Thursday 26 February 2015

Put images into video and add simple music

0

Here we make simple video with images, we show the images with time interval and add simple transaction between the images that make the video attractive, I also add simple audio music in the video and finally make the beautiful video of children. This video is made in Ulead Video Studio 2010 software as per client requirement.


Read More »

Wednesday 11 February 2015

Entity Relationship Model or ER Model

0

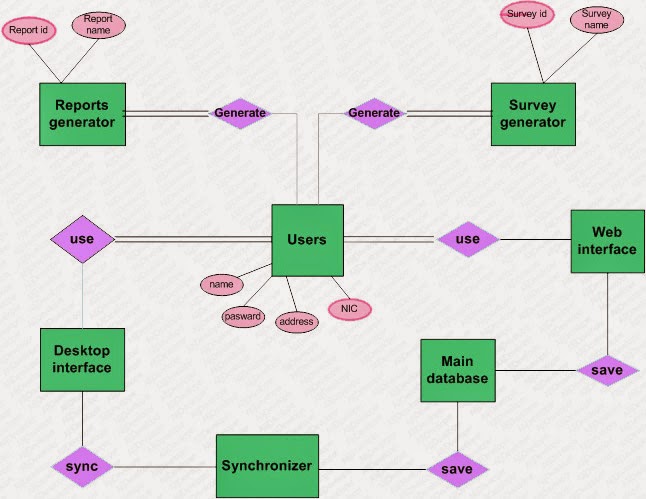
We are developing the Project 'Survey Builder', and here we develop the Entity Relationship Model or in short ER Model of Survey Builder.
But the question is What is an Entity-Relationship Model, ER Modeling is a top down approach to database design, it is a detailed, logical representation of entities associations and data elements for an organization or business. 

Notation used for ER Modeling:
For designing the ER Modeling, a special notation or symbols are used. These notations are:
- Data entities
- Relationships
- Attributes


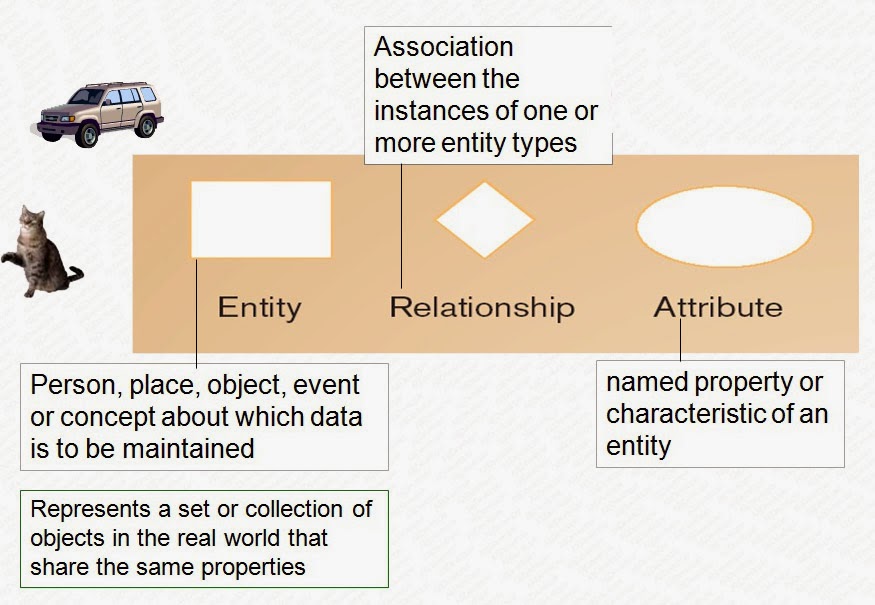
Examples of entities:
–Person: EMPLOYEE, STUDENT, PATIENT
–Place: STORE, WAREHOUSE
–Object: MACHINE, PRODUCT, CAR
–Event: SALE,REGISTRATION, RENEWAL
–Concept: ACCOUNT, COURSE
Guidelines for naming and defining entity types:
–An entity type name is a singular noun
–An entity type should be descriptive and specific
–An entity name should be concise

–Event entity types should be named for the result of the event, not the activity or process of the event.

Example of entity types and associated attributes:
          STUDENT: Student_ID, Student_Name, Home_Address, Phone_Number, Major


Guidelines for naming attributes:
       An attribute name is a noun.
An attribute name should be unique
To make an attribute name unique and clear, each attribute name should follow a standard format
Similar attributes of different entity types should use similar but distinguishing names. 

Candidate key
Attribute (or combination of attributes) that uniquely identifies each instance of an entity type
Some entities may have more than one candidate key
Ex: A candidate key for EMPLOYEE is Employee_ID, a second is the combination of Employee_Name and Address.
If there is more than one candidate key, need to make a choice.
Identifier

A candidate key that has been selected as the unique identifying characteristic for an entity type


In above diagram an entity named Staff that have four Attribute, where StaffID is the Candidate key or Primary key.


How to Evaluate a Data Model

A good data model has the following:
–Accuracy and completeness
–Non redundancy
–Enforcement of business rules
–Data Re-usability
–Stability and Flexibility
–Communication Effectiveness
–Simplicity
Read More »

Tuesday 10 February 2015

Data Flow Diagrams (DFD) of Survey Builder (Part 2)

2


First question that arise in our mind that what is Data Flow Diagrams (DFD). so in simple words DFD is Captures the flow of data in a system. 
It helps in developing an understanding of system’s functionality. What are the different sources of data, what different transformations take place on data and what are final outputs generated by these transformations. It describes data origination, transformations and consumption in a system. Information is organized and disseminated at different levels of abstraction. Thus this technique becomes a conduit for top down system analysis and requirements modeling.

The Notation
There are several notations of the data flow diagrams. In the following, four different shapes are explained. 

Process
What are different processes or work to be done in the system?
Transforms of data.


External Agent
External systems which are outside the boundary of this system, these are represented using the squares


Data Store
Where data is being stored for later retrieval. Provides input to the process Outputs of the processes may be going into these data stores.


Data Flow
Where the data is flowing.
Represents the movement of the data in a data flow diagram.


Adding Levels of Abstraction to Data Flow Modeling

As we have already described that in data flow modeling only those processes can be expressed that perform certain processing or transformation of information. Now the question arises how far these processes need to be expressed? if we start adding each bit of system functionality in a single data flow diagram, it would become an enormously large diagram to be drawn on a single piece of paper. Moreover, requirement analysis is an ongoing activity in which knowledge expands as you dig out details of processes. Therefore, it may not be possible for an analyst to know each bit of all the processes of the system from the very beginning. Keeping the complexity of systems in view, data flow modeling technique has suggested disseminating information of a system in more then just one levels of abstraction. What are these levels please see below for a discussion

Context Level or 0 level Data Flow Diagram
In a top-down system analysis, an analyst is required to develop high level view of the system at first. In data flow modeling, this high-level view is the Context level data flow diagram. In this diagram, system’s context is clarified such that all the external agents or entities with which the system interacts are captured. It captures the details of what information flows between the system and these external entities, and what outputs are generated against inputs from these external agents and so on. So, the analyst probes out all the external agents that may involve persons, organizations or other systems who directly interacts with this system and their specific involvement in the system. At this level, systems internal details are not exposed, as we want to see system behavior as a black box.


Above diagram shown is Context level or 0 level Data Flow Diagram. in which three external agent, one Process and one Data Store is shown.
Read More »

Detailed Data Flow diagrams or level 1 DFD (Part 3)

0


Once context of a system has been captured using context level diagram, the analyst would expand his activities and start digging out system’s internal details. Therefore, the same context level diagram is further expanded to include all major processes of the system that make up system functionality. So, instead of portraying system as a black box entity, the analyst would add processes that deal with the external agents and produces certain outputs. This is level one of a data flow model.

In part 2 we draw the Context Level or level 0 DFD, as shown the figure below: now we further expend this diagram and drawn the Level 1 Data Flow Model.


1. First of all we expend the activities of Administrator, as shown the diagram given below:


Here we explain the activities of Administrator, Administrator will manage the user accounts, and record the data. Administrator is manage the FAQ, Administrator will generate the survey, generate the reports, and Administrator have right to synchronize the local database with main database and also maintain the both databases. 

2. Second we expend the activities of Unregistered Users, as shown the diagram given below:


Unregistered User will create a new account or use the FAQ services of the application. Once it will create the new account, its information will save in record,

3. Now we further expend the activities of Registered Users, as shown the below diagram:


Registered user will do the following tasks:
   a.  Registered user will use the desktop interface as well as web interface of application.
   b.  It will also generate the survey.
   c.  It will generate the different kind of reports.
   d.  It will use the FAQ services.
   e.  Through web interface it will synchronize the local database to main database.


Read More »

Use Case Diagram of Survey Builder (Part 1)

0
Survey Builder
Software Requirements Specification (SRS)
Use Case Diagram


Project Scope:

The Survey Builder software will be used by different users such as business developer, and different companies, also these surveys can be conducted in the field workers on laptops as Desktop application. This software will provide different kind of surveys for different domains and industries, and also available on web. Users of this software can also print the whole survey on hard copy so that can be conducted anywhere by any one. Software will provide interface to the users to save these surveys in our local or global database, and after conducting surveys will synchronize the data with main database using web services, so different users specially different companies used these information for detailed reporting and analysis, and they can see data in different form such as graphical and text reports and conclude the result and can be used in the future.
Read More »

Monday 9 February 2015

Floor Plan of Plot size 25 X 50 feet

0

Here we create a floor plan of plot, that size is 25 feet width and 50 feet height. This plot plan is specially design for the Countries of south Asia, specially for India and Pakistan. If we look plot from up to down, first we design two bed room with attach bath, the size of left room is 12.5 by 10 feet and size of baths are 5 by 4 feet. Between the two bath a open sky taros is design. Beside left room a tv launch of size 12.6 by 16 feet, on right side kitchen is design of size 10.5 by 6 feet. Beside kitchen Car porch is design and stair is start for upper portion. one thing is important that stairs are separate from ground portion. on left side of car porch design a sitting room of size 12.6 by 11.5 feet. 


Read More »

Saturday 7 February 2015

make vidoe with still images and add simple music

0

This Video is Made through Still images and add simple music, during video, add some transaction between the images, that make the cool effaces, The tool used for making this video is Ulead Video Studio 2010


Read More »